Benchmarking our value proposition against key competitors
A Power BI model of our value proposition vs. key competitors, the fact base for pricing, positioning and strategy from PM to CEO.
In short
Universal Robots needed a repeatable, fact-based view of how its value proposition compared with key competitors. I built a multi-perspective survey and a Power BI model that turned 300+ data points into a living instrument for pricing, positioning and strategy.
The result: one dashboard used from product manager to CEO, and a senior management team that was, in the Pricing Director's words, "tremendously impressed".
The challenge
Benchmarking lived in one-off decks. Every pricing or positioning question triggered a new round of ad-hoc analysis, and the answers rarely agreed.
- No shared fact base across pricing, product and management
- Competitor comparisons rebuilt from scratch for each request
- Internal views never tested against partners, customers and non-customers
- Slow turnaround from question to decision
Universal Robots needed a solution that could:
- Compare the value proposition against 12 key competitors on one scale
- Combine internal, partner, customer and non-customer perspectives
- Filter by department, metric, competitor and industry
- Stay current without a researcher in the loop for every question
From one-off decks to a living benchmarking instrument
I designed a multi-perspective survey (internal, partner, customer, non-customer), coded the responses into a structured framework and built the Power BI model on top, filterable by department, metric, competitor and industry.
AI automated ingestion, first-pass coding and chart drafting. The framing, the axes and the executive narrative stayed with me, and were presented from PM level up to the CEO.
Key value drivers
- Fact-based pricing and positioning
- One shared view from PM to CEO
- Repeatable instead of ad hoc
- Faster from question to decision
Tasks solved by the model
- Competitive benchmarking of the value proposition
- Multi-perspective feedback consolidation
- Executive share-outs and strategy input
Challenges solved
- Fragmented competitor knowledge
- Ad-hoc benchmarking requests
- Untested internal assumptions
- Slow decision cycles
What changed.
- 4
- Perspectives, internal, partner, customer, non-customer
- 12
- Competitors tracked
- 300+
- Feedback data points
- CEO
- Reached decision-maker
- ↳Adopted as the fact base for competitive benchmarking, pricing and positioning decisions.
- ↳Presented and used from product manager level up to the CEO.
- ↳Ad-hoc benchmarking requests fell to near zero, the dashboard answered them.
“Our senior management team, including the CEO, were tremendously impressed with the first results and how this could be used on an operational and strategic level. This is what outstanding researchers, analysts and strategists do!”
The instruments behind the findings.
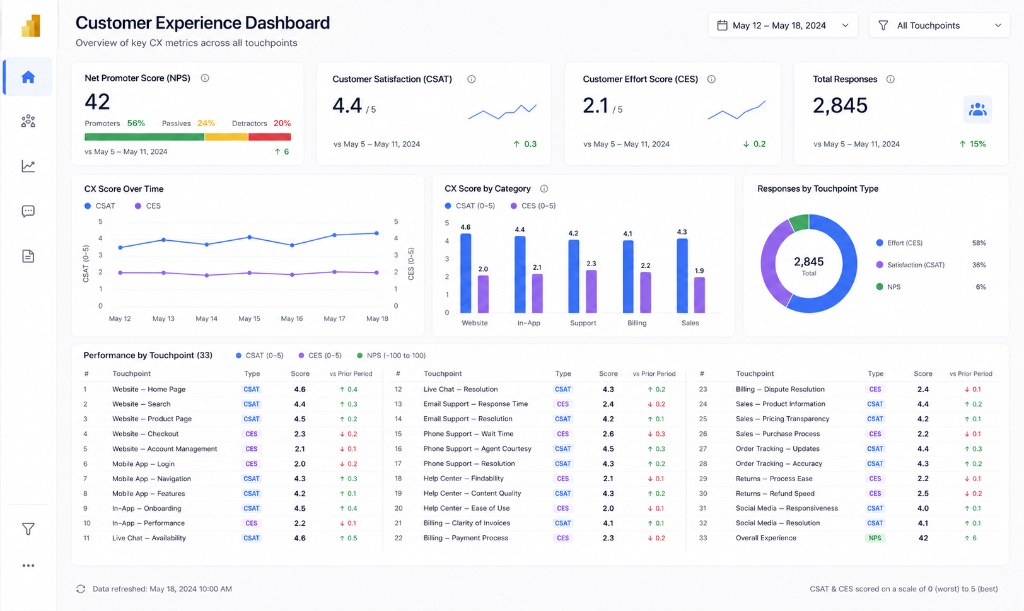
UR customer-experience dashboard (NPS, CSAT, CES by touchpoint), the sister instrument to the benchmarking model.
UR programme artefact. The benchmarking dashboard itself contains competitor data and is not published.
What I’d do differently.
Next time: a 20-minute data-literacy walkthrough for each stakeholder. The dashboard was powerful; the leap from "dashboard exists" to "dashboard changes a decision" is smaller when people can read it themselves.